This week, I used Hayabusa to analyze some Windows Logs. Hayabusa is a Windows event log timeline generator that uses Sigma rules to parse logs. It's a really nifty tool if you are looking to build a sequence of events for an incident in your environment. In addition, Hayabusa a can produce outputs that are friendly with SIEM tools such as Splunk. This post will walk you through Hayabusa's basic features.
(Fun fact: "Hayabusa" means peregrine falcon in Japanese.)
Installation
Installation was very straightforward on my Linux system. I simply navigated to the Hayabusa releases page and downloaded and uncompressed the archive for x64 systems.
Then, it was just a matter of running the executable from the terminal:
$ ./hayabusa

┏┓ ┏┳━━━┳┓  ┏┳━━━┳━━┓┏┓ ┏┳━━━┳━━━┓
┃┃ ┃┃┏━┓┃┗┓┏┛┃┏━┓┃┏┓┃┃┃ ┃┃┏━┓┃┏━┓┃
┃┗━┛┃┃ ┃┣┓┗┛┏┫┃ ┃┃┗┛┗┫┃ ┃┃┗━━┫┃ ┃┃
┃┏━┓┃┗━┛┃┗┓┏┛┃┗━┛┃┏━┓┃┃ ┃┣━━┓┃┗━┛┃
┃┃ ┃┃┏━┓┃ ┃┃ ┃┏━┓┃┗━┛┃┗━┛┃┗━┛┃┏━┓┃
┗┛ ┗┻┛ ┗┛ ┗┛ ┗┛ ┗┻━━━┻━━━┻━━━┻┛ ┗┛
   by Yamato Security

Hayabusa v2.18.0 - SecTor Release
Yamato Security (https://github.com/Yamato-Security/hayabusa - @SecurityYamato)

...
(In the name of cleanliness/readability, I renamed the Hayabusa executable to "hayabusa".)
Getting Some Sample Logs
You have a couple options here.
First, you could grab your own Windows logs from your own machine by copying all of the files at C:\WINDOWS\system32\config\.
Or, if you don't have access to a Windows machine/don't want to do that (or you want some spicier logs), you can head over to this git repo and check out some of Hayabusa's sample logs. I ended up choosing the EVTX_full_APT_attack_steps because they map the logs to steps in the MITRE ATT&CK framework.
Once you have a directory of logs, you can throw them inside the logs directory in the root of the Hayabusa repo:
.
├── config
├── hayabusa-2.18.0-lin-x64-gnu
├── logs # <-- Here!
├── output.csv
└── rules
Now, we're ready to create our first timeline.
Creating a CSV Timeline
Before we make our timeline, we need make sure Hayabusa's Sigma rulesets are up to date using the following command:
$ ./hayabusa update-rulesAfter updating the rulsets, we can create a timeline using our logs by pointing Hayabusa at our directory of logs. In my case, the command looked like this:
$ ./hayabusa csv-timeline --d logs/EVTX_full_APT_attack_steps/ --o output.csvAfter running this command, Hayabusa will ask you which set of rules you would like to run. I chose to apply all alerts.
? Which set of detection rules would you like to load? ›
  1. Core (2,051 rules) ( status: test, stable | level: high, critical )
  2. Core+ (3,602 rules) ( status: test, stable | level: medium, high, critical )
  3. Core++ (3,928 rules) ( status: experimental, test, stable | level: medium, high, critical )
  4. All alert rules (4,471 rules) ( status: * | level: low+ )
❯ 5. All event and alert rules (4,586 rules) ( status: * | level: informational+ )
After this, a few more configuration prompts will pop up. You'll generally be fine to stick with the defaults for all of those.
Now we have a CSV timeline of our event logs!
Analyzing the Timeline
When you open your CSV timeline file, you will be met with a fairly intimidating spreadsheet.
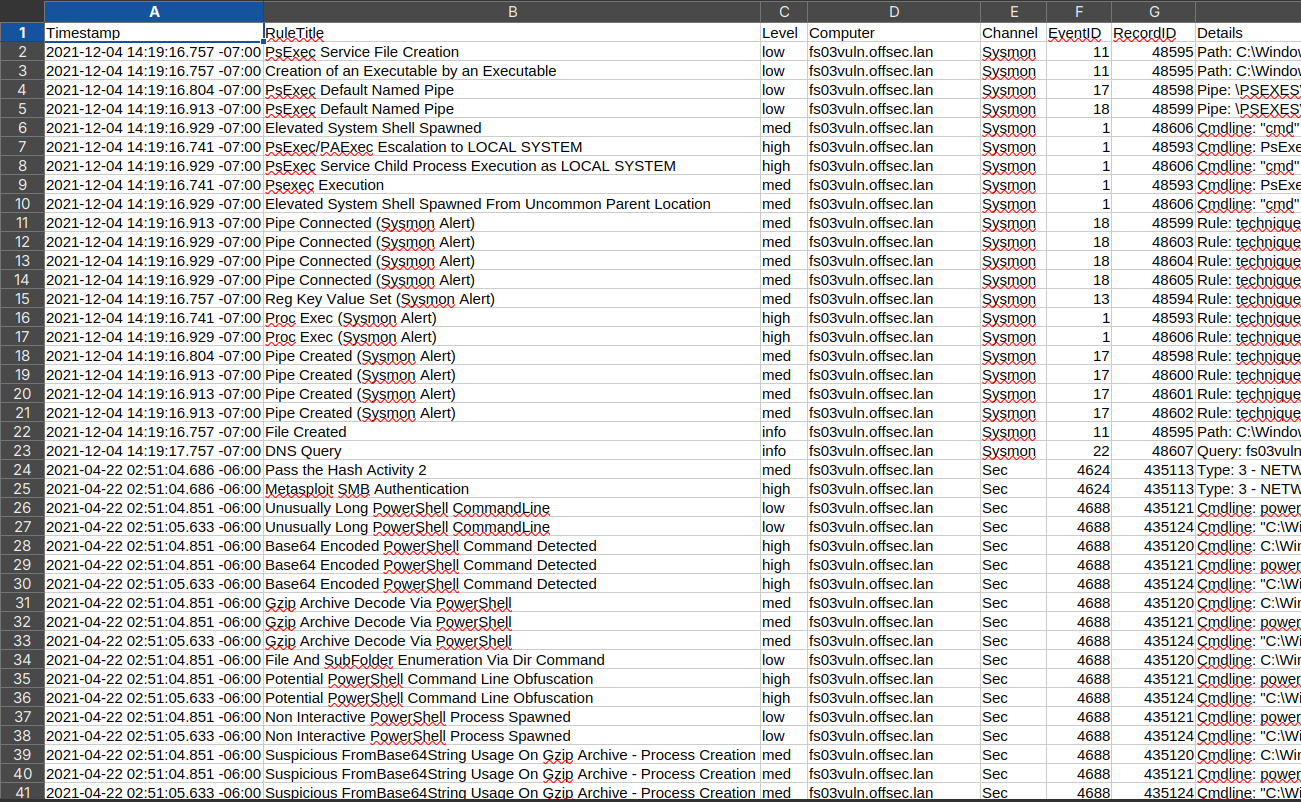
We can add filters to the columns of the timeline to help make sense of all of this data. First, highlight all of the data in the sheet using "Ctrl+A". If you're in Excel, add the column filters using "Ctrl+Shift+L". If you're in Libre Office, the shortcut is "Shift+Ctrl+L".
After doing this, you should be able to see little dropdowns for each column:

Now we can sort the events by their timestamp, filter the events by their severity, and more!
Next Steps
Here are some tips as you go about analyzing these logs:
-
Filter by high severity logs. What kind of things are you seeing?
-
Look at the commands that are being run on the system. What exactly are they doing?
-
Can you draw out a specific timeline from these logs? (Whiteboards are great for this!)
-
Go back and use the logon-summary command for Hayabusa. How does the information provided from the output of this command affect your timeline?